The importance of serosurveillance
Knowing how many Canadians had developed antibodies against SARS-CoV-2 (the virus that causes COVID-19) from infection or vaccination was essential for tailoring public health strategies during the COVID-19 pandemic. This insight became even more valuable in December 2021 when the Omicron variant of concern changed the transmission patterns of SARS-CoV-2 dramatically due to its high transmissibility and immune evasion. The resulting “tsunami” of infections meant that testing for acute infection using PCR could no longer keep up with demand. Serosurveillance became one of the only viable approaches for COVID-19 surveillance in Canada during the Omicron waves, with the CITF leading the way in serosurveillance reporting.
For a comprehensive description of pan-Canadian seroprevalence across Canada, please see our peer-reviewed analysis in the Canadian Medical Association Journal (CMAJ).

How do serosurveys work?
Serosurveys determine the rate of seropositivity to SARS-CoV-2 in a population by measuring the presence of antibodies against components of the virus in an individual’s blood. Infected individuals respond by making antibodies against multiple viral proteins, including the nucleocapsid and the spike proteins. In North America, all approved vaccines elicit an antibody response to the spike protein and its receptor binding domain, not the nucleocapsid. Therefore, when an individual has IgG antibodies that recognize the nucleocapsid protein (anti-N), it is interpreted as a sign of past infection (at least 2 or more weeks in the past). When an individual has IgG antibodies that recognize the spike protein (anti-S), it could be due to either vaccination or infection (at least 2 or more weeks in the past).

SARS-CoV-2 seroprevalence across Canada
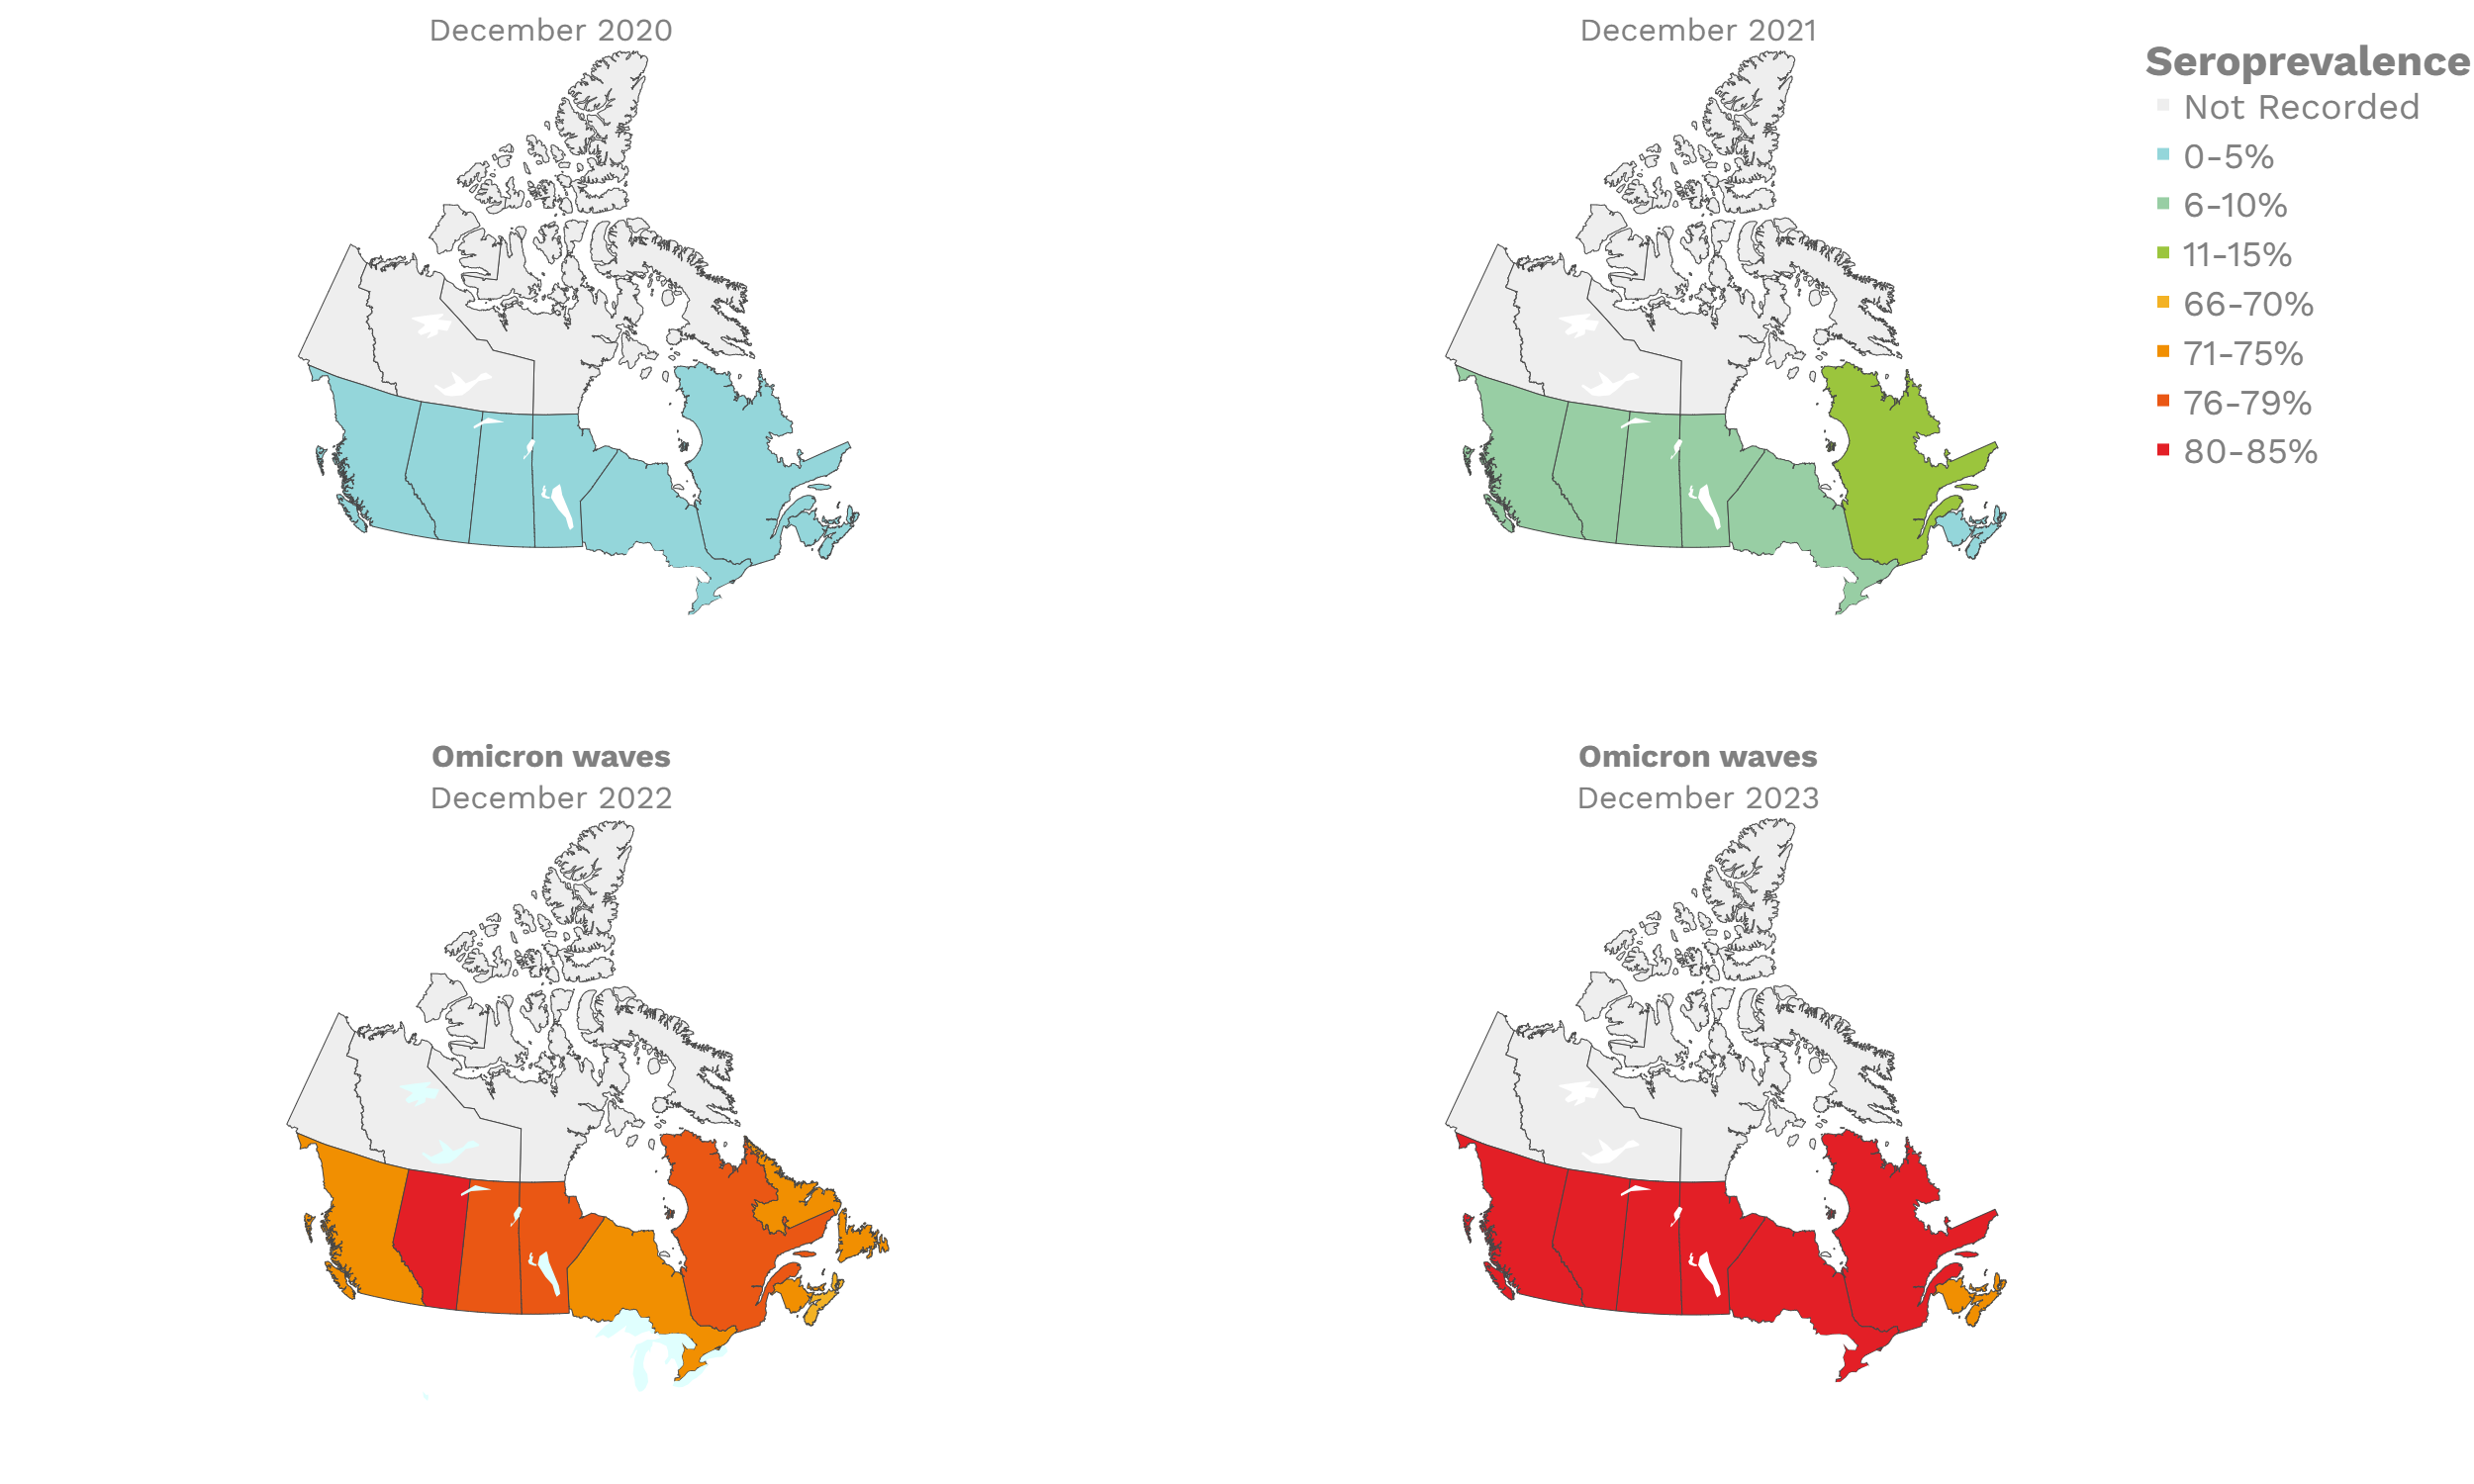
These interactive maps illustrate the percentage of Canadian adults with infection-acquired antibodies at the end of the year in each stage or year of the pandemic (2020 to 2023).
Infection-acquired seroprevalence by four stages of the pandemic
Pre-vaccine era
Despite the pressure on the healthcare system, initial seroprevalence results from Wave 1 (April-June 2020) revealed that less than 1% of people in Canada had been infected (as measured by anti-N). Despite being a low percentage, these estimates indicated that approximately four times more Canadians had been infected than were detected through acute infection testing (PCR), supporting the hypothesis that mildly symptomatic and asymptomatic infections could transmit SARS-CoV-2. Canadian seroprevalence after Wave 2 (fall of 2020) increased to 1.5% and reached 2.3% (95% CI: 1.91 – 2.78) in December 2020. These findings indicated that widespread immunity would not be achieved quickly through exposure to the virus, reinforcing the importance of rapidly distributing vaccines.
Vaccination
Vaccination in Canada against COVID-19 began in December 2020. The vaccines had high effectiveness not only against severe COVID-19 disease and death but also against transmission of the early variants. Therefore, despite the relaxation of public health measures and two further waves of infection, including one dominated by the Delta variant, seroprevalence due to infection remained low, at less than 10%, by November 2021. In contrast, between January and October 2021, anti-S seroprevalence rose steeply in Canadian adults mainly due to vaccination. By November 2021, 96% (95% CI: 92 to 98) of Canadian adult blood donors and research study participants had antibodies due to vaccination or infection.
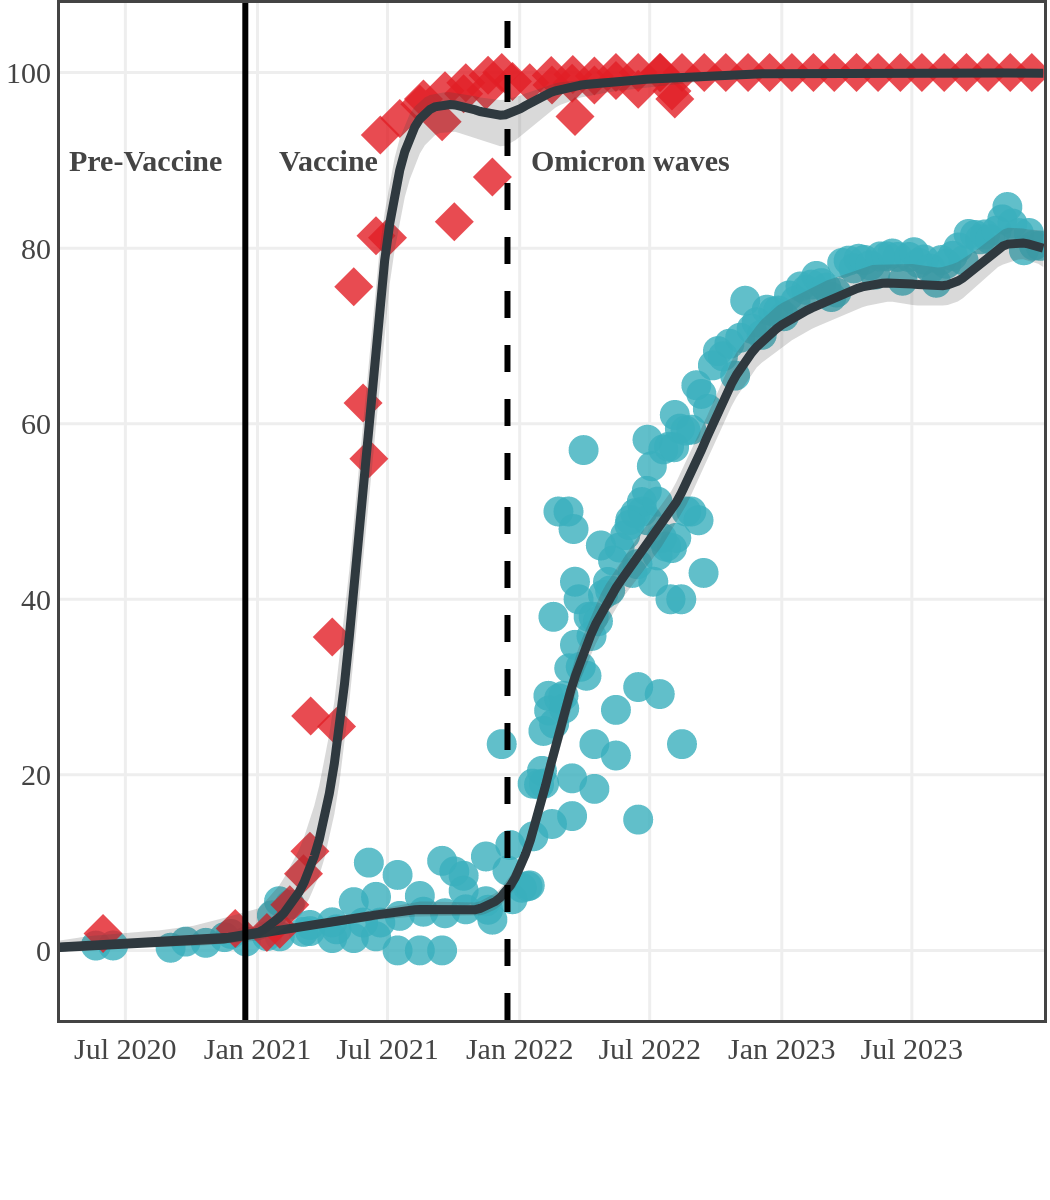
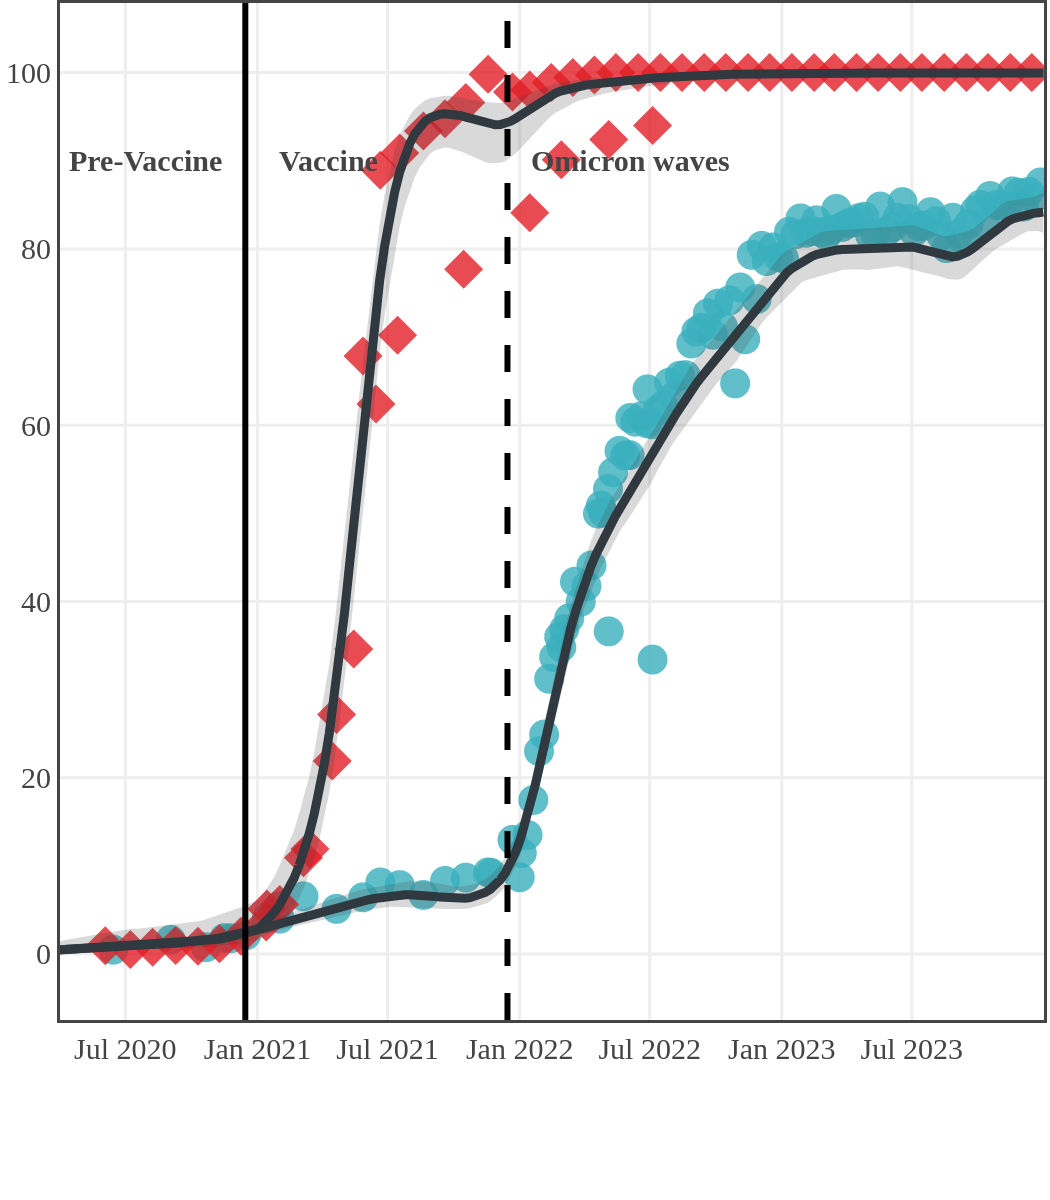
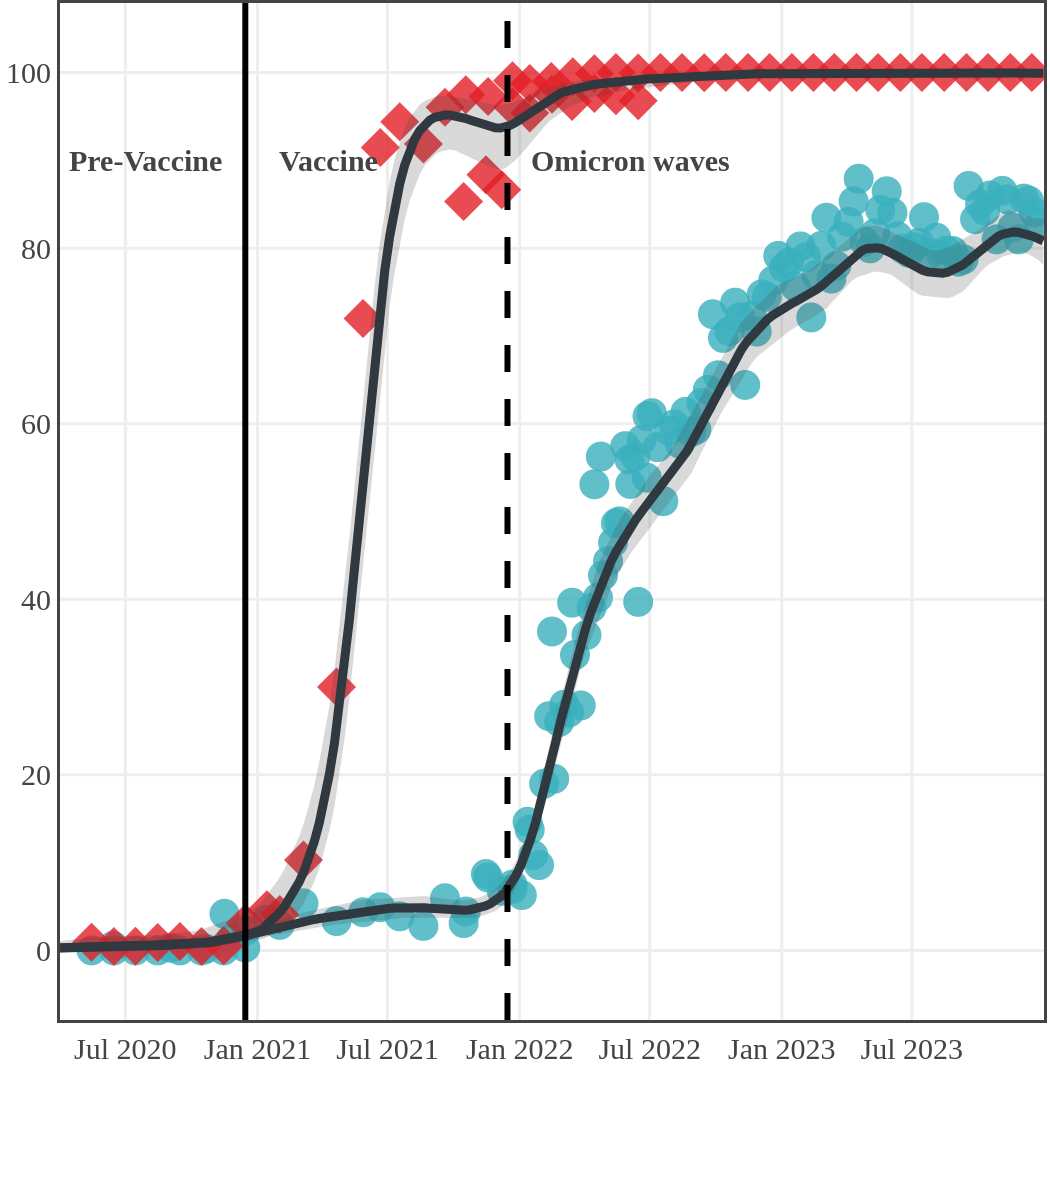
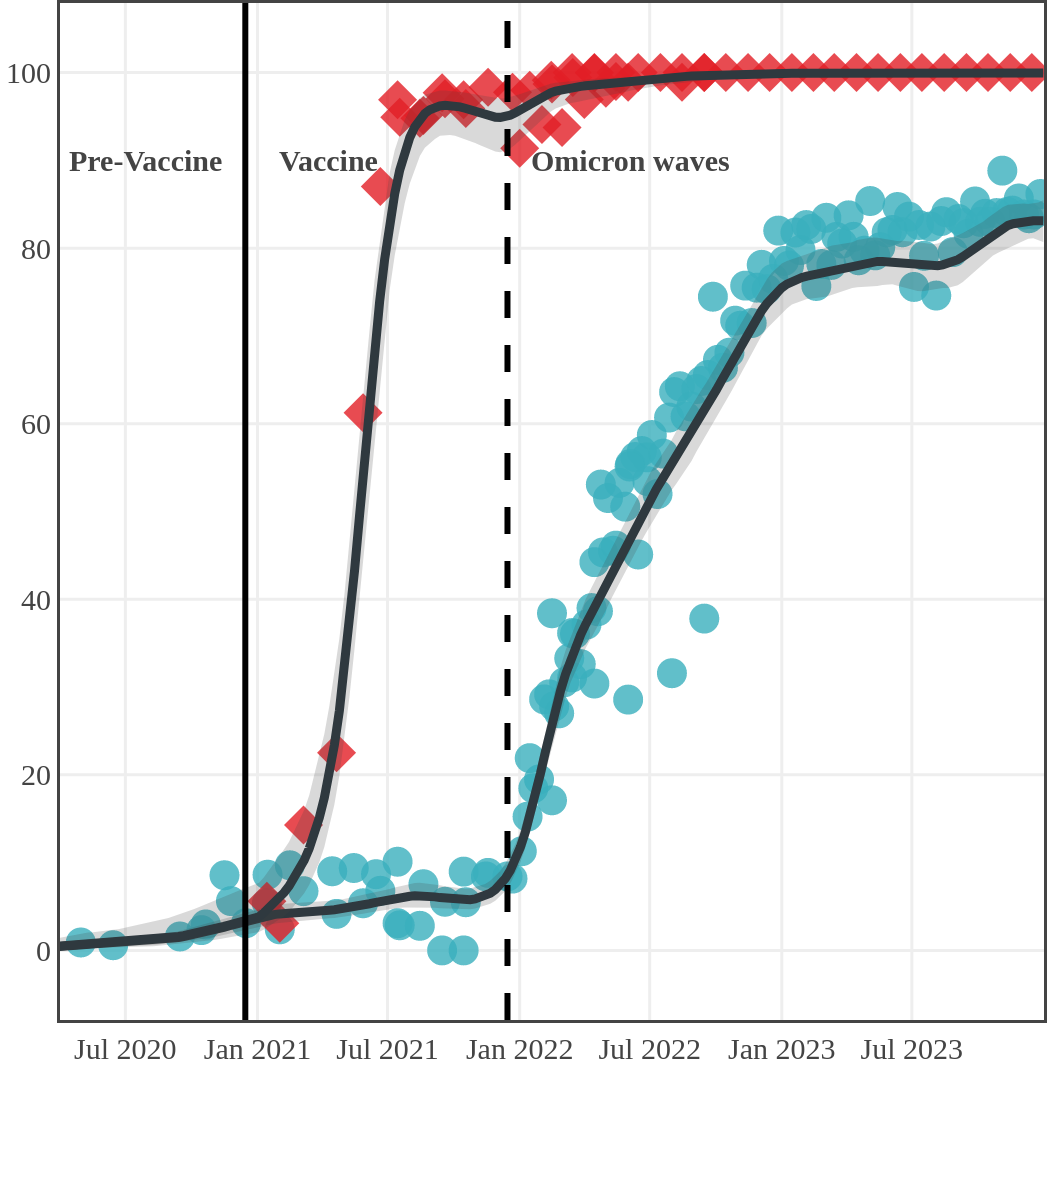
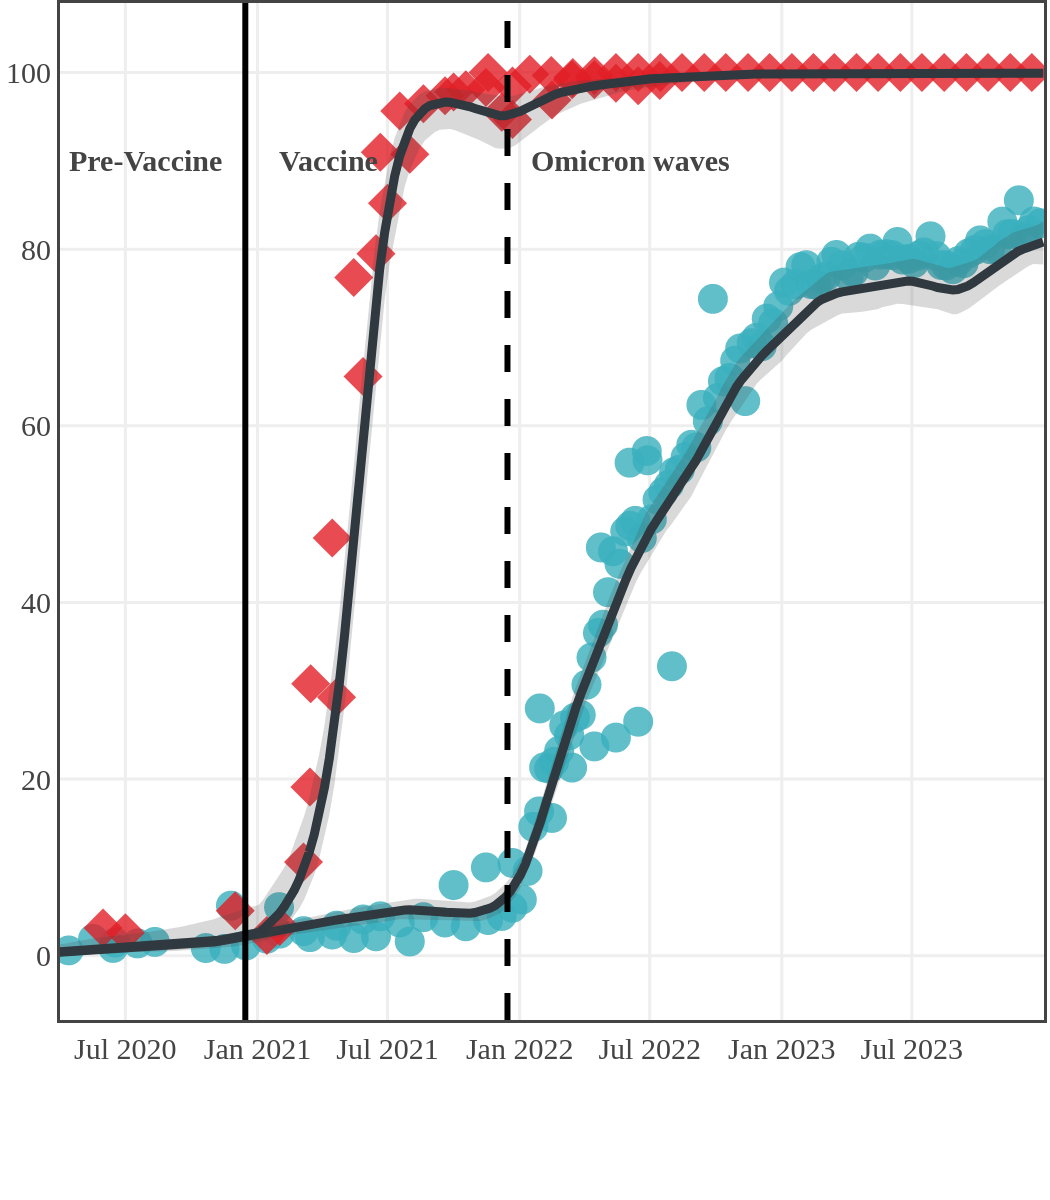
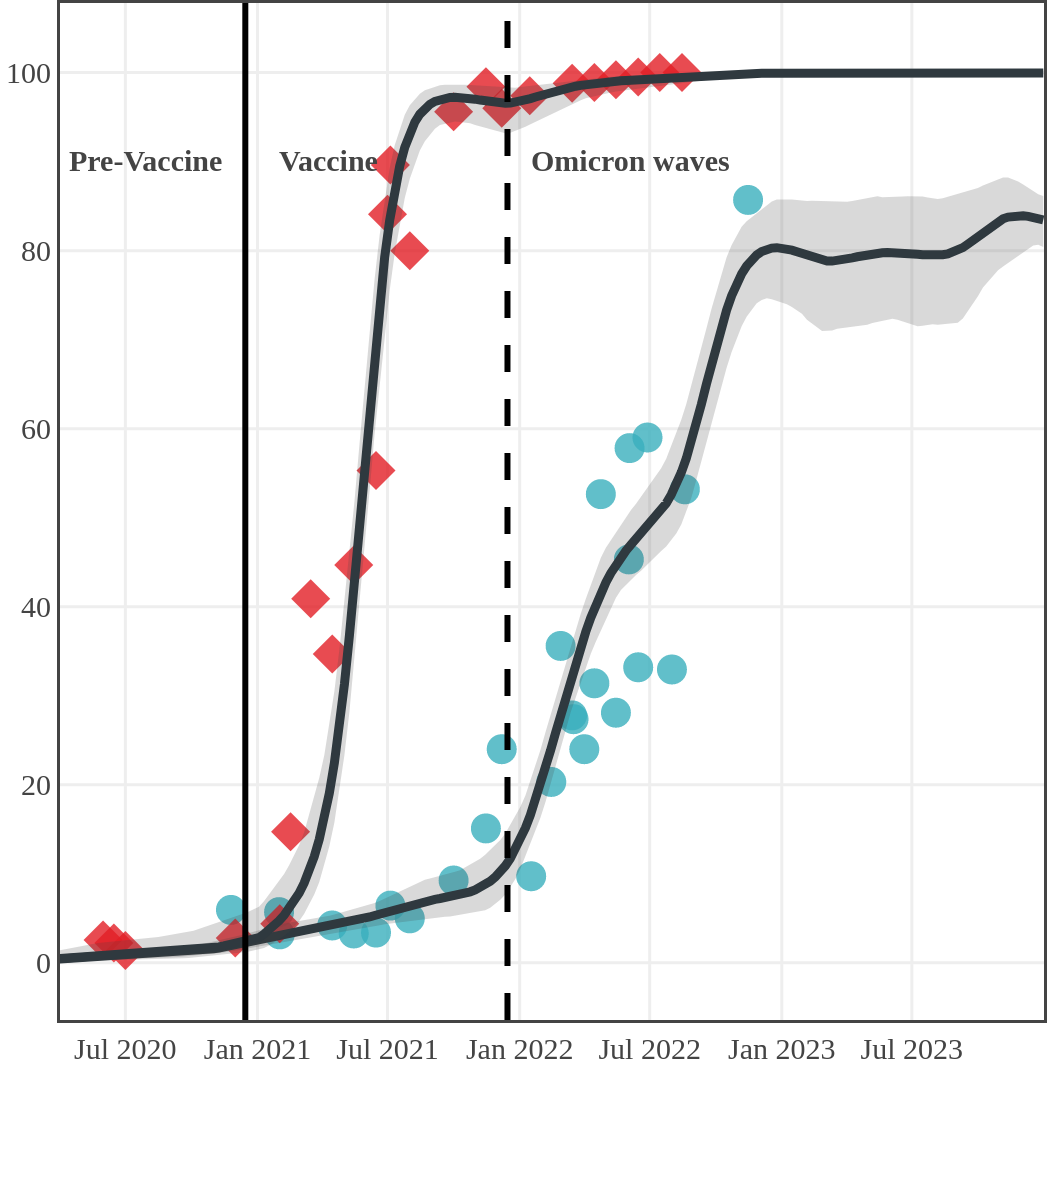
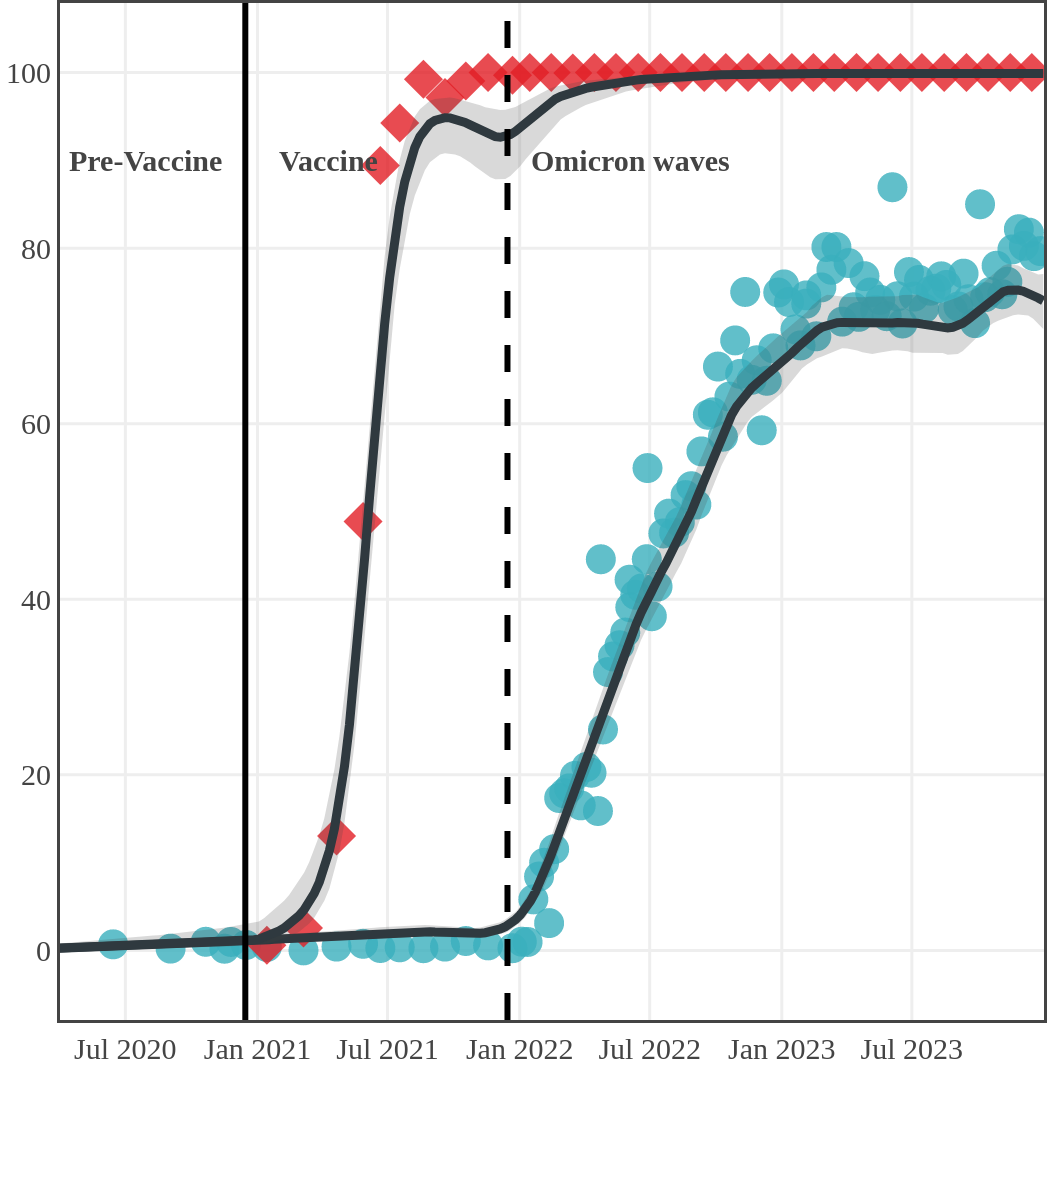
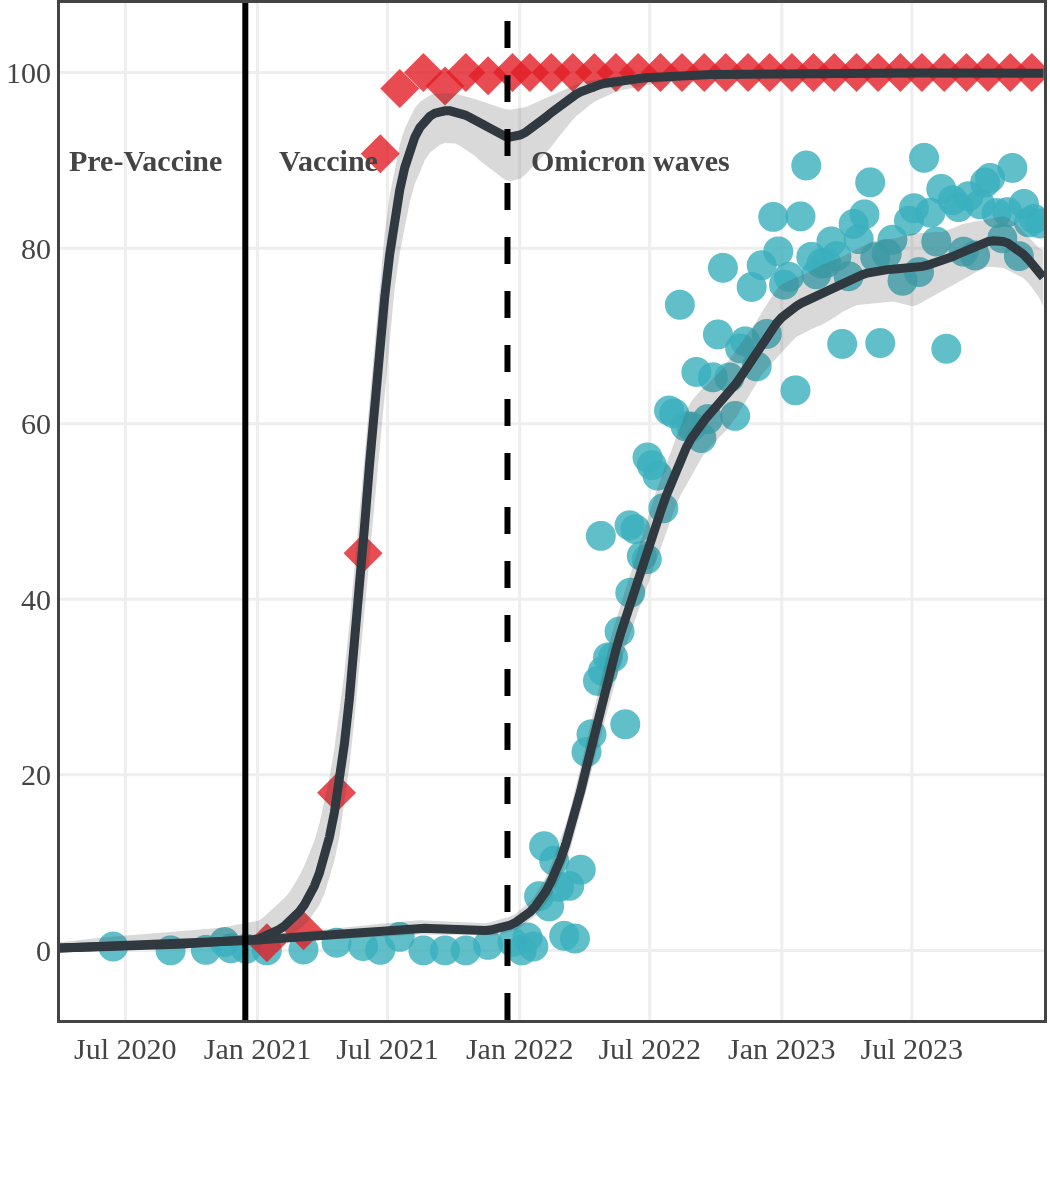
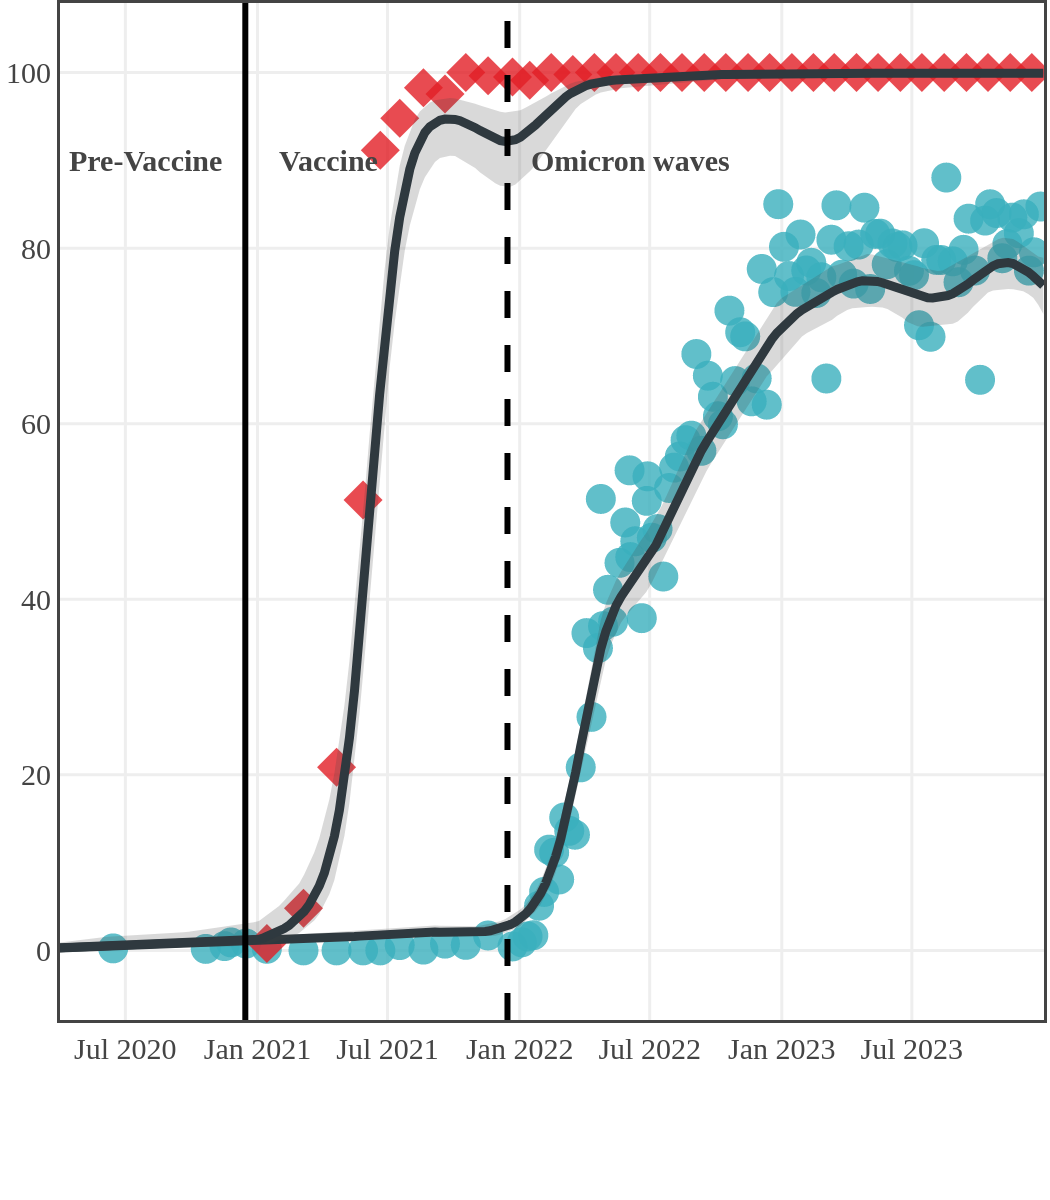
The next plot shows seroprevalence acquired from infection (anti-N; dots) and seroprevalence acquired from infection or induced from vaccination (anti-S; diamonds) for all age groups, combined, by region over time.
Omicron waves
The infection ‘tsunami’ brought on by the emergence of the Omicron variant changed the course of the pandemic. The Omicron waves hit Canada during the December 2021 holidays, causing infection-acquired seropositivity to increase dramatically. While seroprevalence studies estimated that fewer than 10% of the population had been infected prior to January 2022, over 70% had been infected by December 2022. Infection-acquired seroprevalence in Canada continued to increase significantly in the second year of the Omicron era. From January 1 to December 31, 2023, infection-acquired seroprevalence increased from 74% (95% CI: 72 to 76) to 81% (95% Crl: 79 to 83).
Infection-acquired and vaccine-induced seroprevalence
(April 13, 2020, to December 31, 2023)
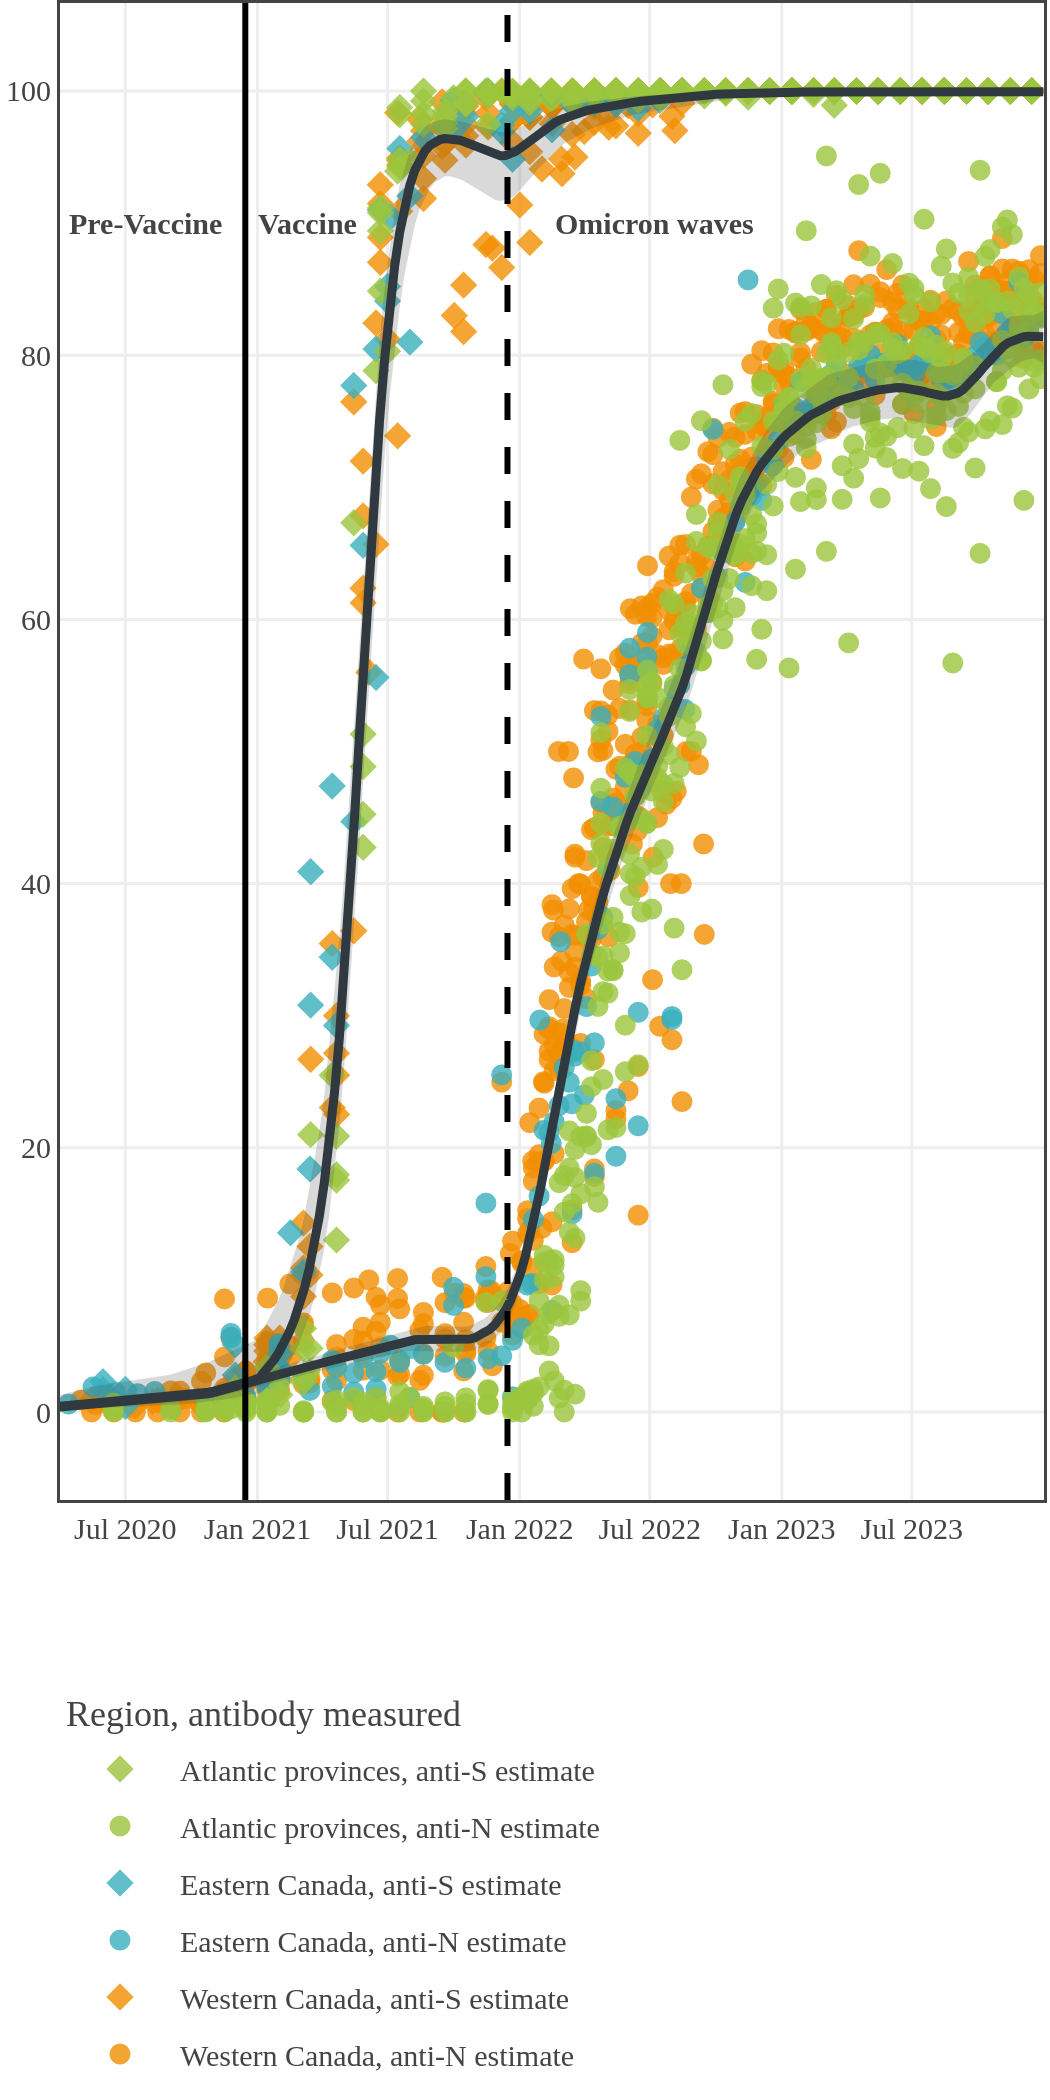
Each point represents a seroprevalence estimate from a project at the mid-point of a sample collection period. The black line represents the estimated average seroprevalence weighted by sample size. The light grey bands represent the 95% credible interval. Western provinces = British Columbia, Alberta, Saskatchewan, and Manitoba; Eastern provinces = Ontario and Quebec; Atlantic provinces = New Brunswick, Nova Scotia, Prince Edward Island, and Newfoundland. Insufficient data were available for the Yukon, Northwest Territories, Nunavut, and Labrador.
The prevalence of antibodies acquired from infection plateaued in spring 2023. However, evidence from other surveillance sources, such as absenteeism and hospital admissions, suggested that infection transmission continued, which was consistent with research in clinical sciences on the nature of SARS-CoV-2 immunology and virology. The observed seroprevalence reflects the net balance between new anti-N antibodies from infection (or restimulated anti-N levels from reinfection) and the decline of anti-N to below detectable levels due to antibody waning (a natural process after many months without exposure to SARS-CoV-2). Reinfections are not easily distinguished from first infections by analysis of seroprevalence alone. Nevertheless, an increase of about 4% was seen during fall 2023. By December 2023, the end of our seroprevalence monitoring project, we estimated anti-N seroprevalence was 81% (95% CrI: 79 to 83), based mainly on blood donors. Anti-S seroprevalence (due to vaccination or infection) was estimated to be essentially 100%, as it had been since summer 2022.

SARS-CoV-2 seroprevalence by province or region
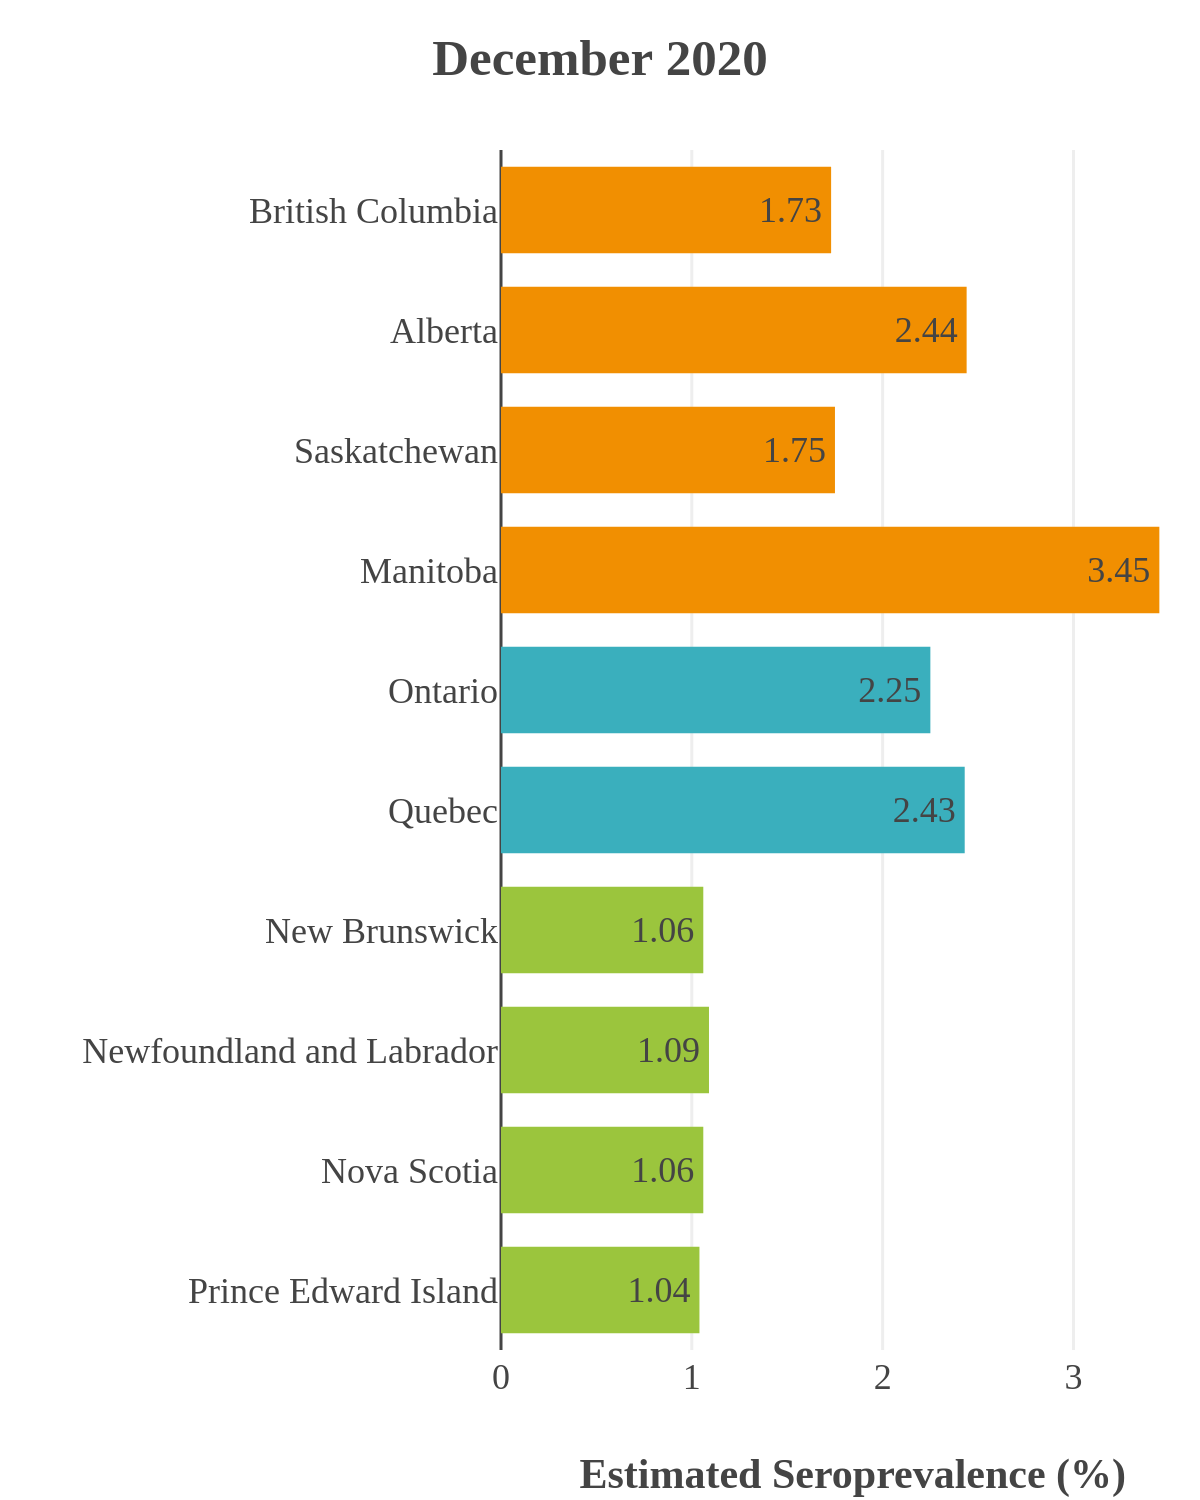
While infection-acquired seroprevalence was low in all provinces throughout 2020-21, it remained near zero in Atlantic Canada (provinces of New Brunswick, Nova Scotia, Prince Edward Island and Newfoundland) due to public health policies implemented to reduce spread. The plot below shows the change in infection-acquired seroprevalence (percent of the adult population with anti-N) from April 2020 to November 2021 by region.
Pre-Omicron era seroprevalence due to infection by province over time
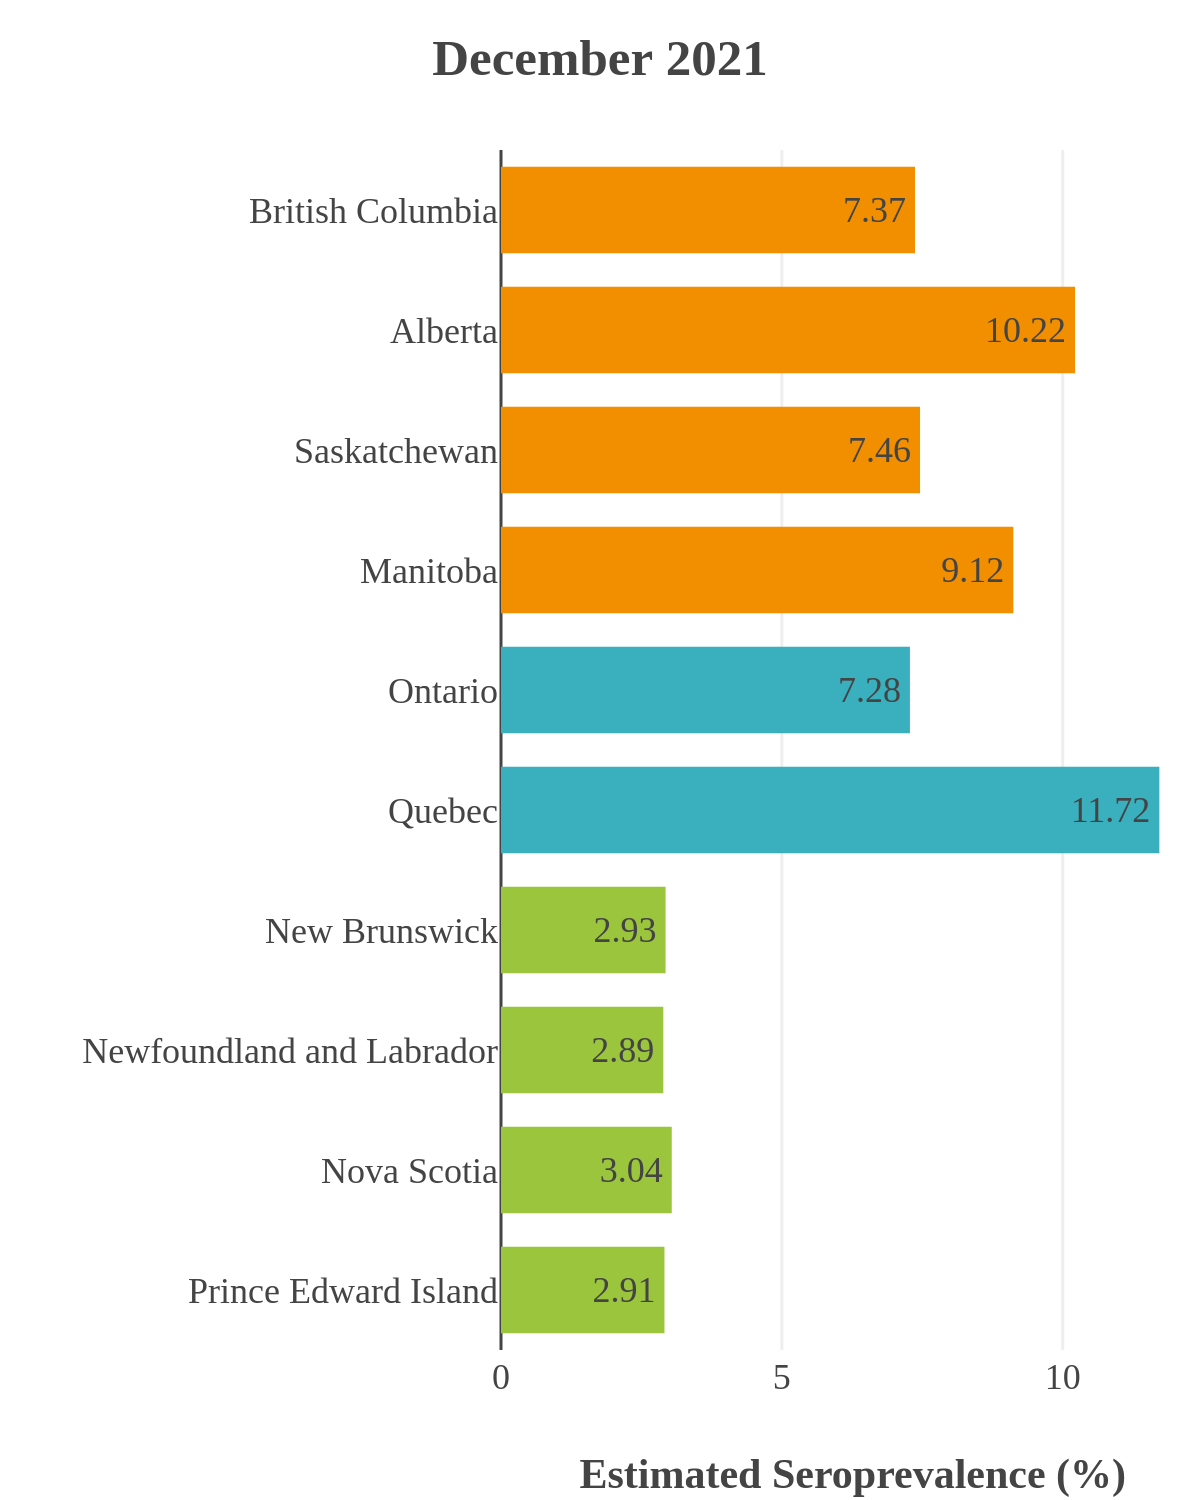
High rates of infection during the Omicron waves were seen across all regions of Canada. Western Canada (provinces of British Columbia, Alberta, Saskatchewan, and Manitoba) usually showed the highest infection-acquired seroprevalence in the general adult population throughout the pandemic, although their rates were not substantially different from those in Ontario and Quebec. The Atlantic provinces, where infection-acquired seroprevalence had been exceptionally low, saw the largest acceleration in infection rates and their infection-acquired seroprevalence caught up with the rest of the country quickly.
Omicron era seroprevalence due to infection by province over time
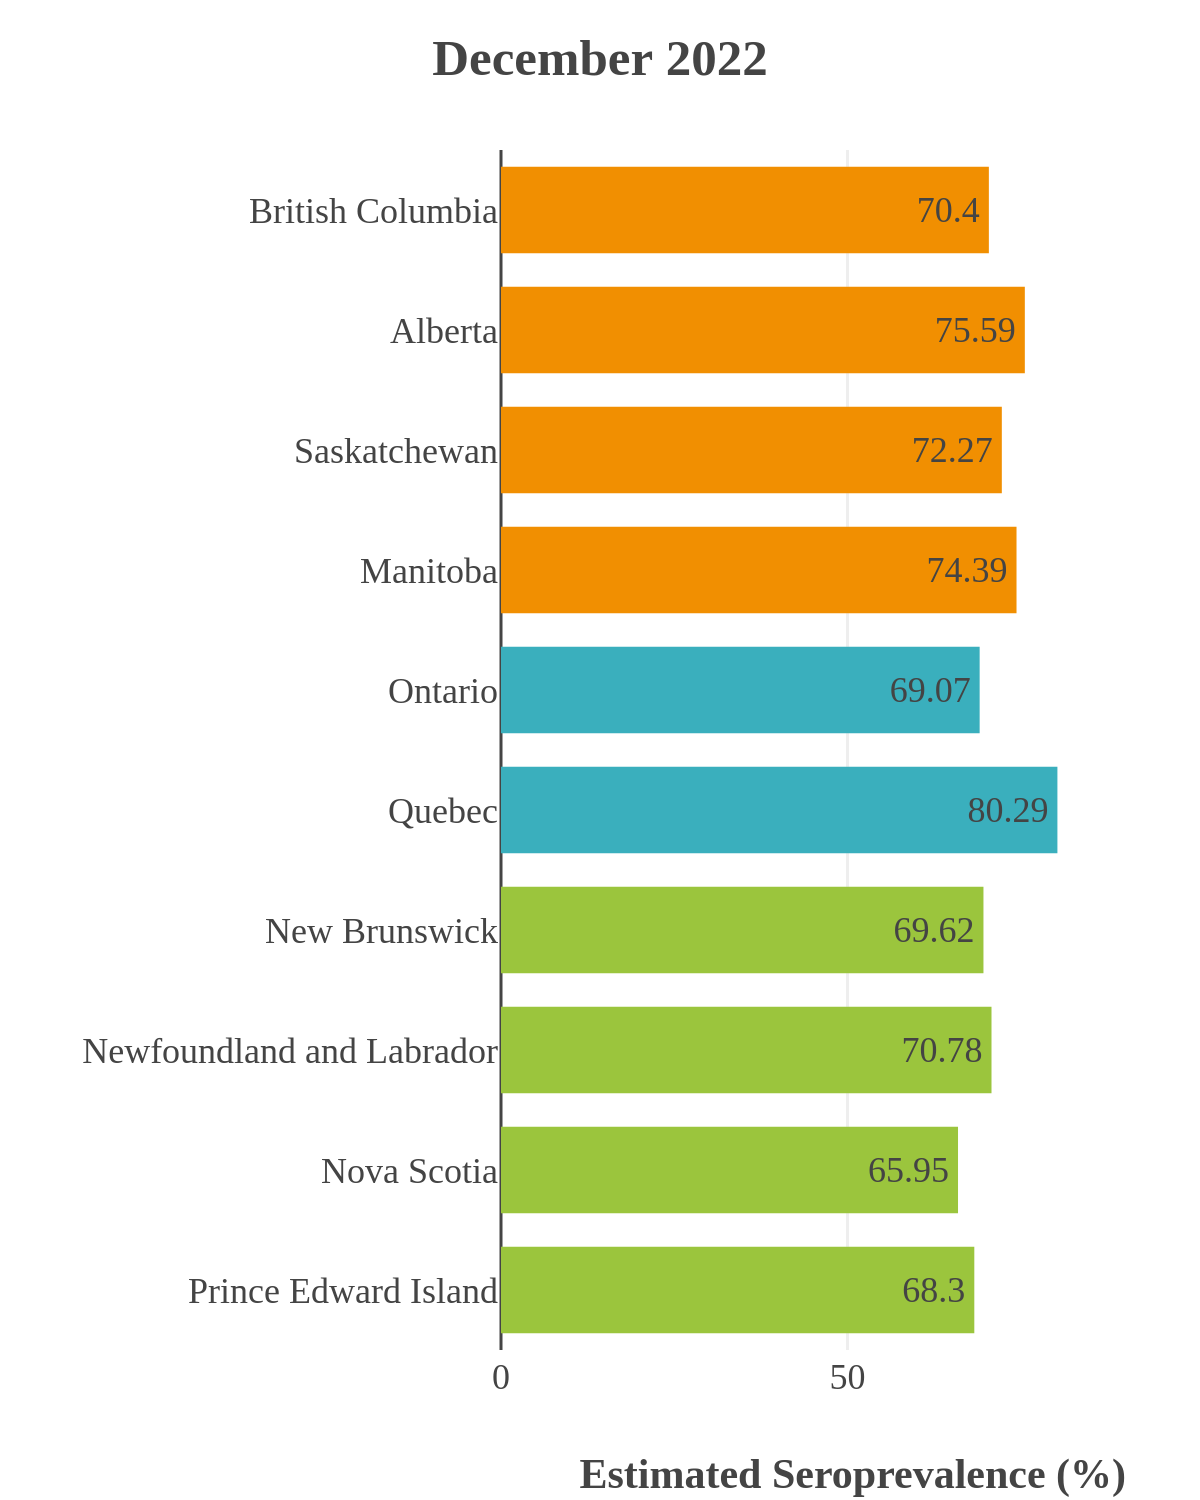
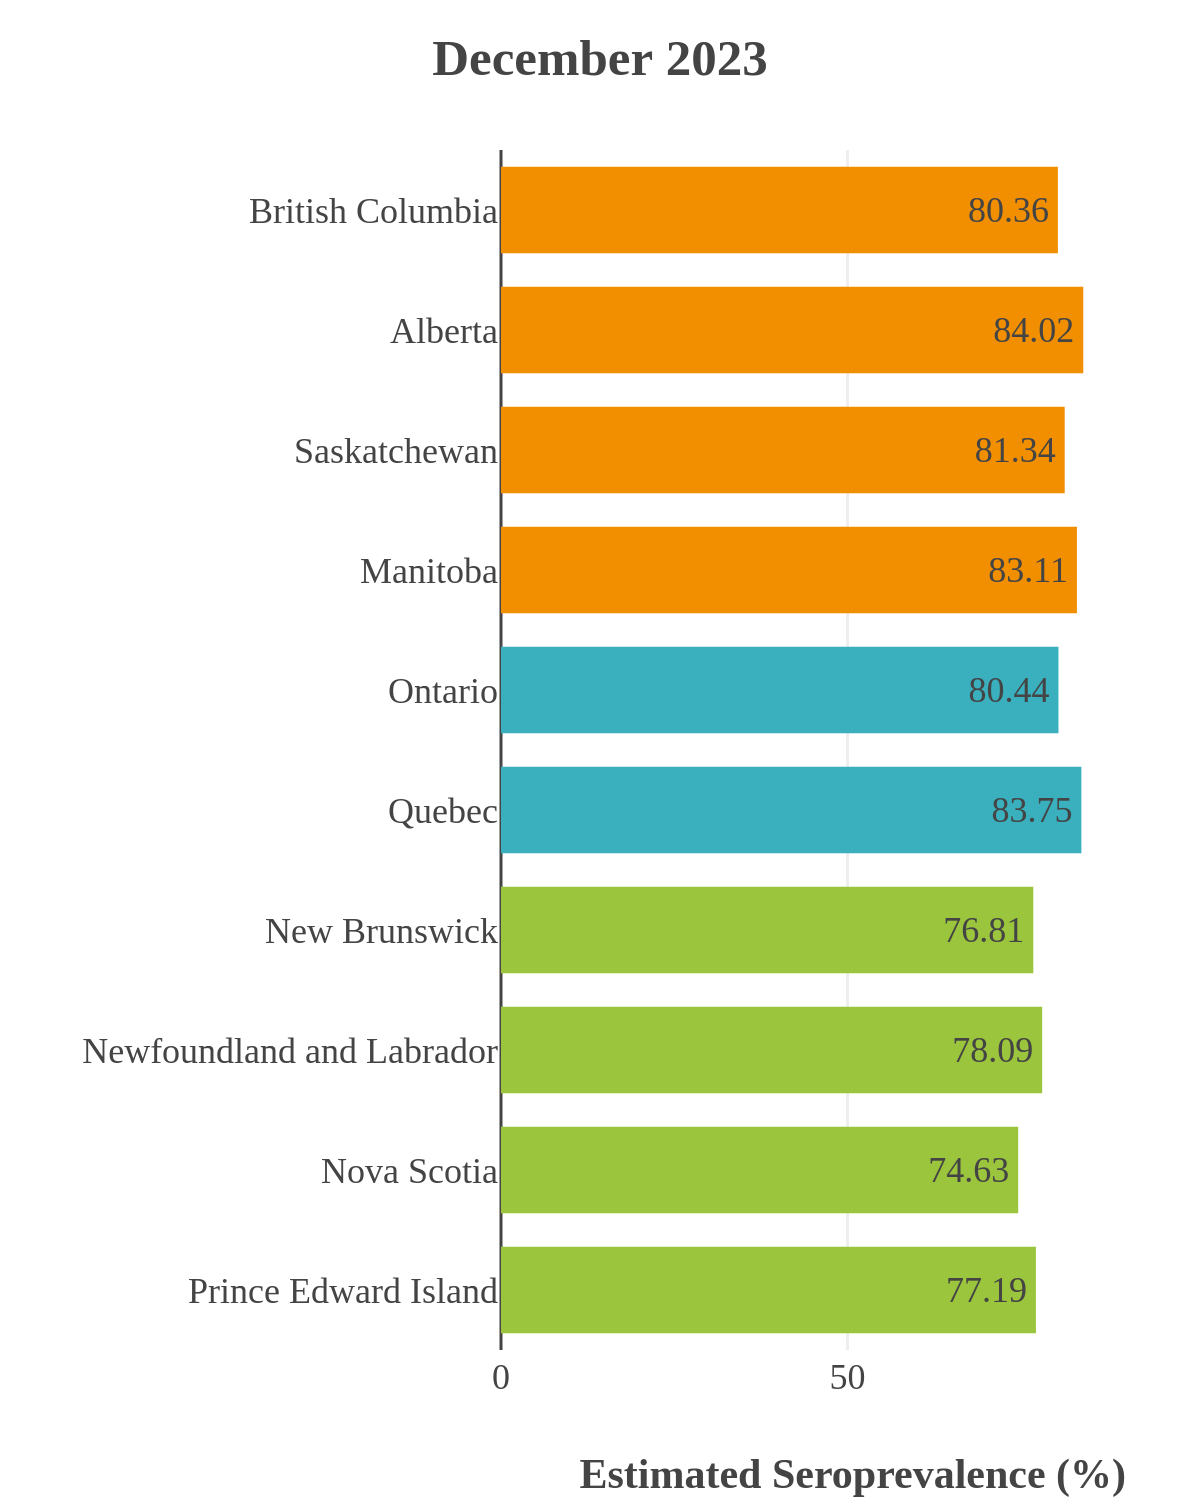
Seroprevalence due to infection and vaccination by province
Antibody measured
| • | anti-N estimate |
 |
anti-S estimate |
British Columbia
Alberta
Saskatchewan
Manitoba
Ontario
Quebec
Nova Scotia
Prince Edward Island
Newfoundland
New Brunswick
Antibody measured
| • | anti-N estimate | |
anti-S estimate |
British Columbia
Alberta
Saskatchewan
Manitoba
Ontario
Quebec
Nova Scotia
Prince Edward Island

Newfoundland
New Brunswick
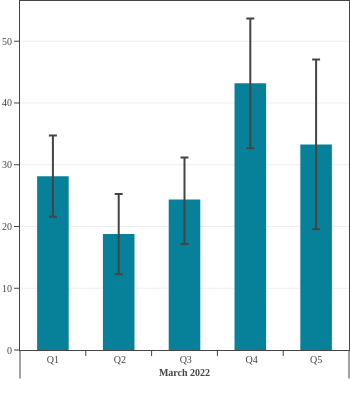
Seroprevalence in the Northwest Territories
A cross-sectional serological survey funded by the CITF and done by Northwest Territories (NWT) Public Health in partnership with Canadian Blood Services, estimated the seroprevalence of SARS-CoV-2 from vaccination and infection among NWT residents, breaking the results down by age group and region.
Seroprevalence due to vaccination or infection was over 95% in the Northwest Territories by January 2023.
- Seroprevalence due to infection rose significantly in all age groups. In spring 2022, 47.3% of residents had antibodies due to infection (95% CI: 42.4 to 52.1) and by January 2023, 79.5% of residents had infection-acquired antibodies (95% CI: 76.9 to 81.9).
- The data suggest children and young adults experienced a rise in infection-acquired seroprevalence earlier in 2022 than did older adults.
- Overall, seroprevalence rose over time, however, due to the limited sample size in children, especially children under 12 years, and young adults, the trend over time is less clear. Adults over age 60 maintained a lower infection rate throughout 2022 as seen in Canadian blood donors from other provinces.
Seroprevalence due to infection and vaccination by age and sampling period
(March 2022 to January 2023)
The mean age was 49 years and 95% of participants fell within an age range of 12- to 83-years-old.


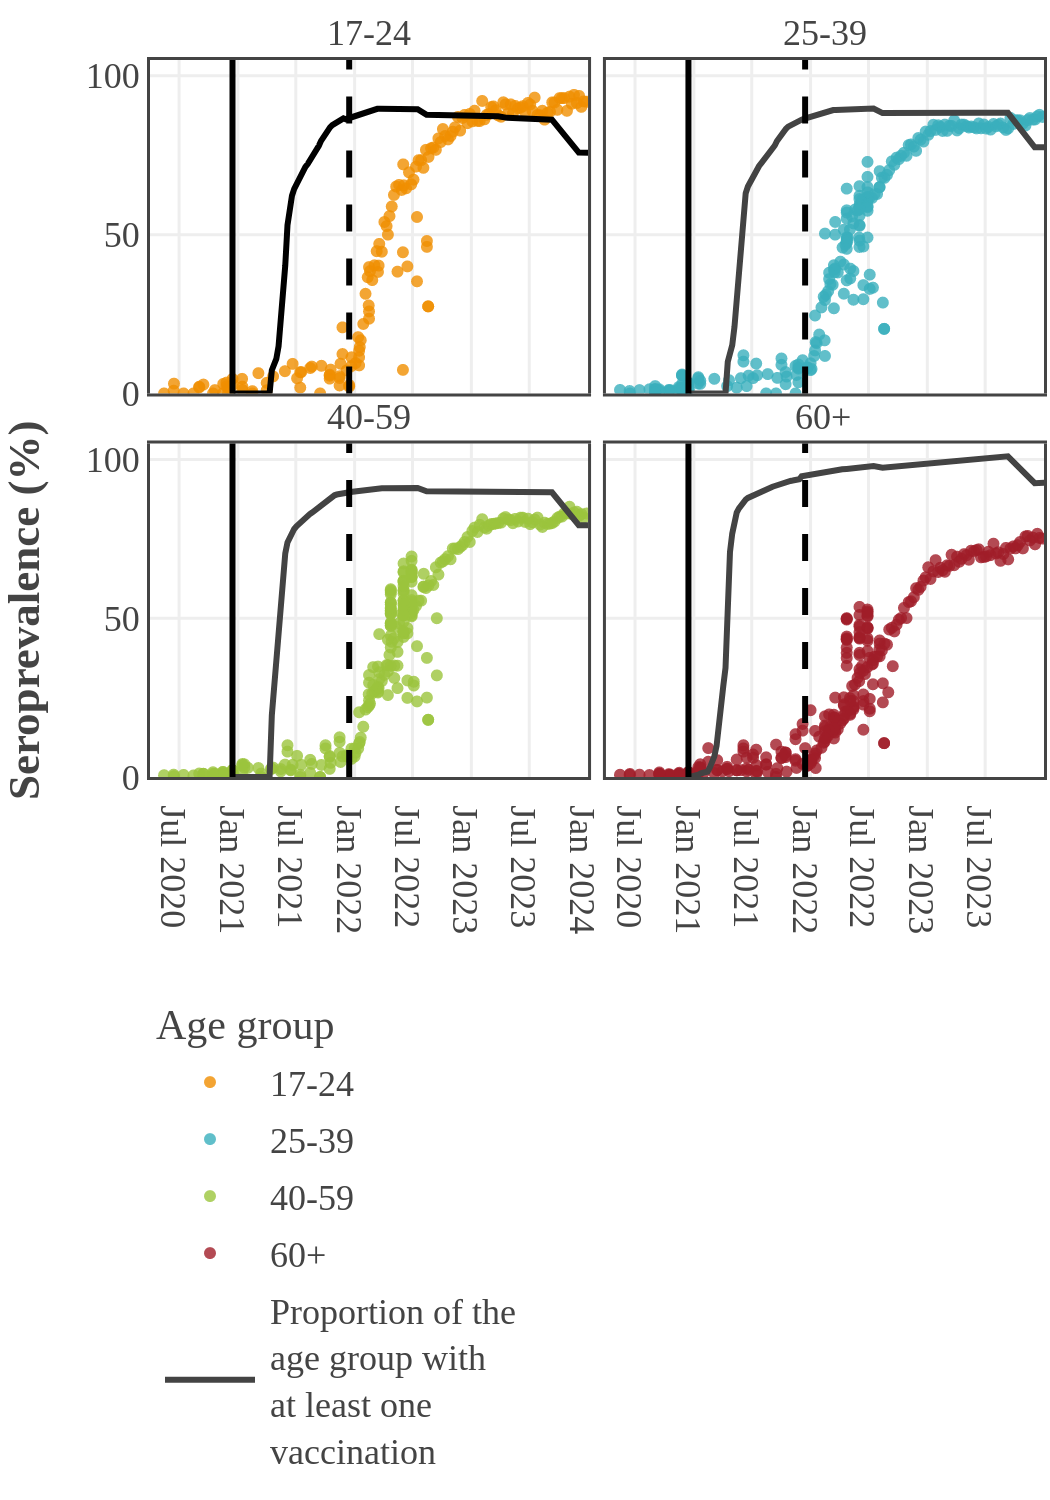
Seroprevalence due to infection by age in Canada
By 2022, the infection rate in younger adults (17-39) surged and surpassed that in older people in Canada. This inverse relationship between infection and age may have two causes. First, older people had higher rates of vaccination and took more precautions to prevent infection following the opening up of the economy. Second, SARS-CoV-2 variants became more transmissible, while at the same time public health restrictions were no longer in place and younger people returned to work and school.
Estimates from pediatric studies suggest that children had infection-acquired seroprevalence similar to or lower than young adults, but estimates varied widely by study and over time. Results from pediatric studies can be found here.
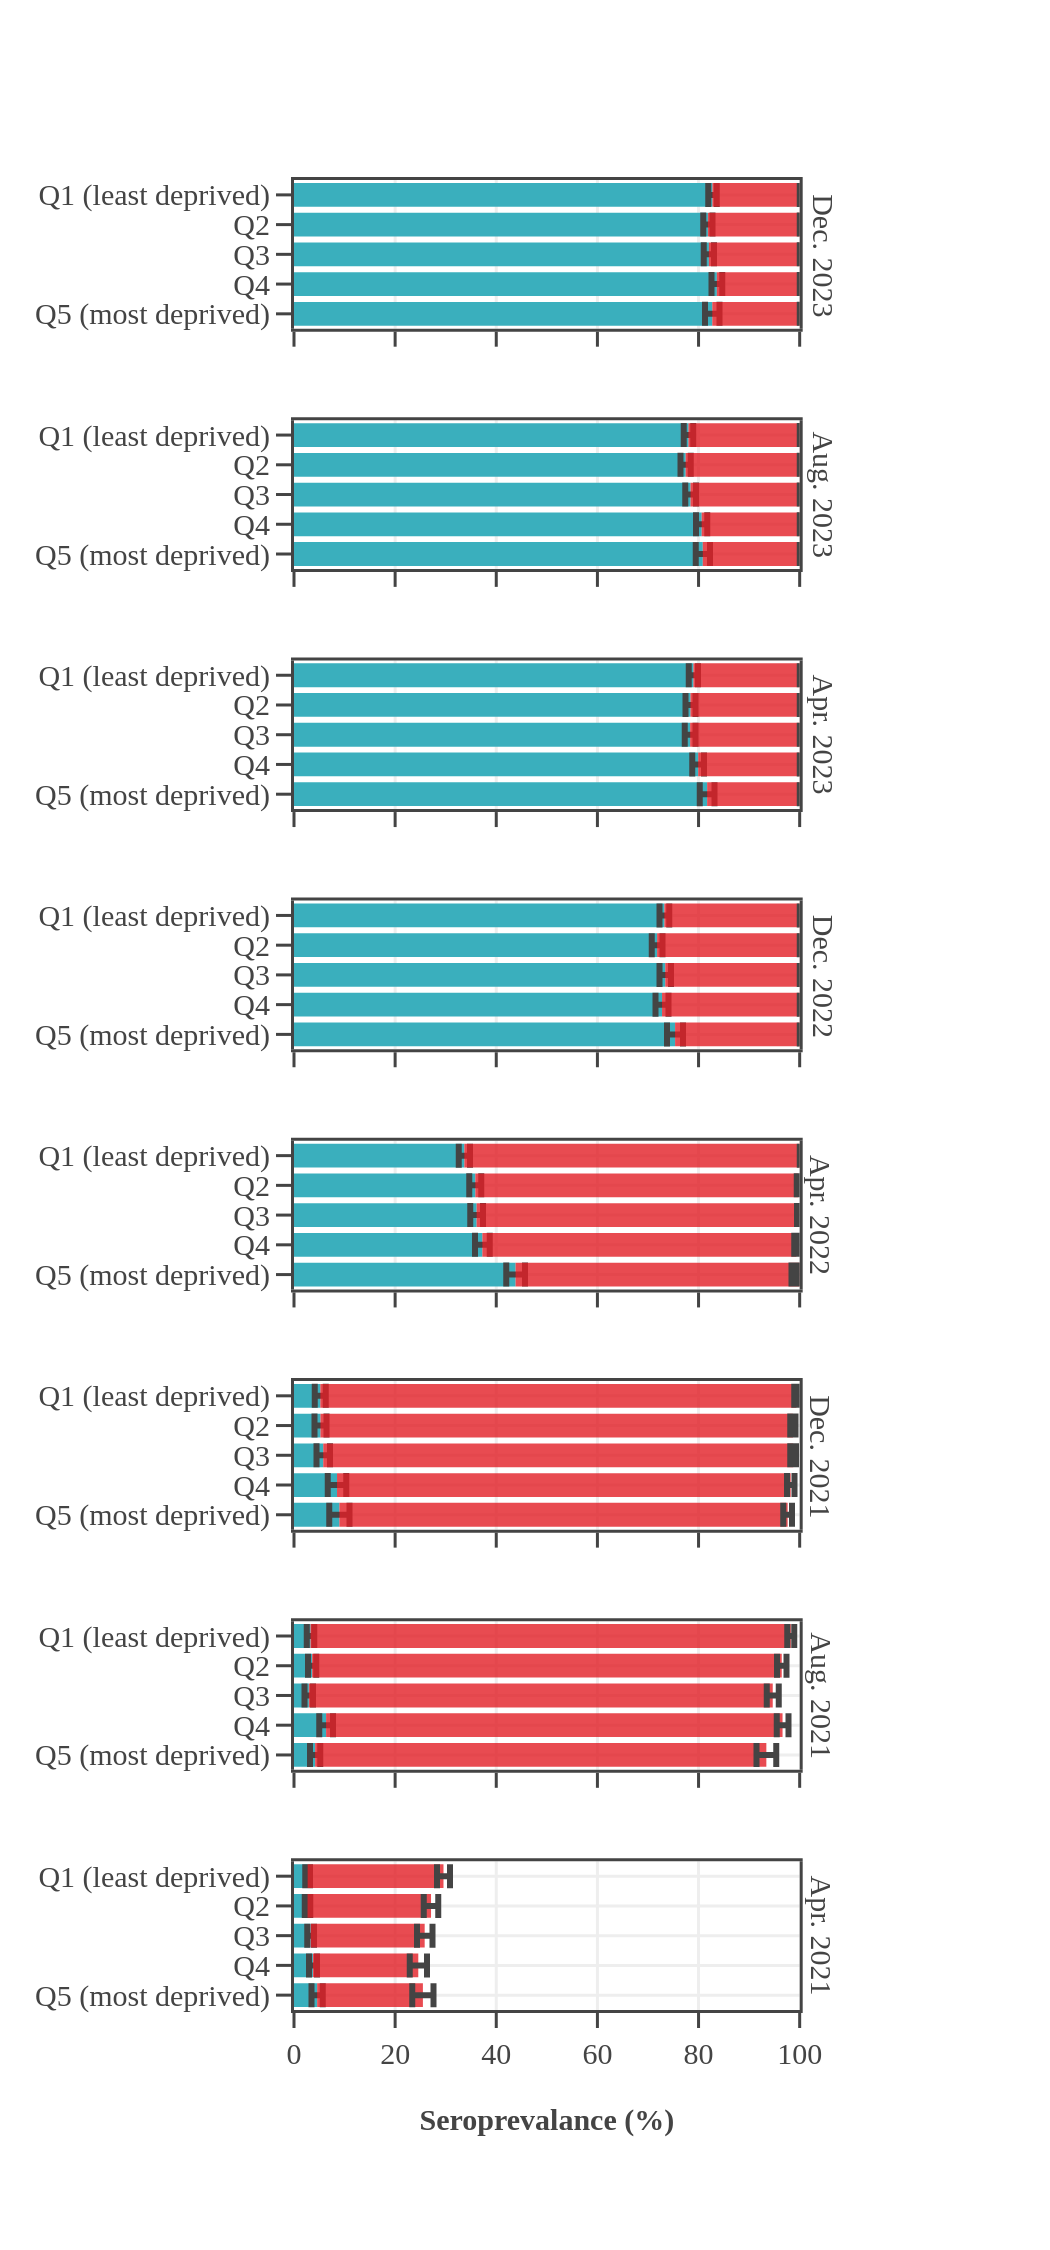
Seroprevalence in blood donors
by socioeconomic status over time
Canada (excluding Quebec and the Territories)
Canadian Blood Services estimated seroprevalence according to material deprivation index, based on the home postal code reported by blood donors. Material deprivation is a neighbourhood-level indicator calculated from the census using information such as average education level, household income, and employment status of the residents in a neighbourhood (Pampalon 2009 [1]). From spring of 2021 to late 2022, results showed that levels of infection-acquired seroprevalence were correlated with material deprivation: seropositivity rates were a little higher in donors from the most socially deprived neighbourhoods (Q4 and Q5) compared to donors in the least socially deprived neighbourhoods (Q1 and Q2). The biggest difference was seen in Spring 2022, after the first Omicron wave, which may be explained, in part, by employment in frontline work being more common in more deprived neighbourhoods. However, by late 2023 the difference in seroprevalence due to infection between groups was not statistically significant. Prior to Omicron, anti-S seroprevalence was also weakly and inversely correlated with material deprivation but the trend disappeared as donors from the full range neighbourhoods reached virtually 100% anti-S seroprevalence.
1 As measured by the Material Deprivation Index, which makes use of postal code data.
1 As measured by the Material Deprivation Index, which makes use of postal code data.
SARS-CoV-2 antibodies
| Infection (Roche assay) | Vaccine only (Roche assay) |
Data notes:
- The bar height shows the estimated proportion of the subgroup who had antibodies to SARS-CoV-2, adjusted for assay sensitivity and specificity and standardized to the Canadian population. Error bars show 95% confidence intervals.
- Antibodies from vaccine only are in red = anti-S IgG positive and anti-N IgG negative.
- Antibodies from infection are in blue = positive for anti-nucleocapsid IgG.
- [1] Pampalon R et al. (2009). A deprivation index for health planning in Canada. Chronic Diseases in Canada. 29(4) Available at: https://www.canada.ca/content/dam/phac-aspc/migration/phac-aspc/publicat/hpcdp-pspmc/29-4/pdf/cdic-29-4-05-eng.pdf

Seroprevalence in blood donors
by racial group over time
Throughout the pandemic, Canadian Blood Services data showed that racialized Canadians (self-reported race) had higher levels of seroprevalence due to infection than Canadians who self-identified as white. For most of 2021, racialized blood donors were nearly twice as likely to have antibodies due to infection than white donors. In the first half of 2022, about 25% more racialized donors had antibodies due to an infection. The gap in rates of infection-acquired seropositivity between the two groups decreased throughout late 2022 and 2023 yet persisted throughout the pandemic. In contrast, the anti-S seroprevalence, reflecting vaccination or infection, did not reveal any consistent differences between white and non-white blood donor populations, with levels reaching 95% in late summer 2021 and remaining high thereafter.
Seroprevalence by race, month, and source of antibodies for Canada
(excluding Quebec and the Territories)
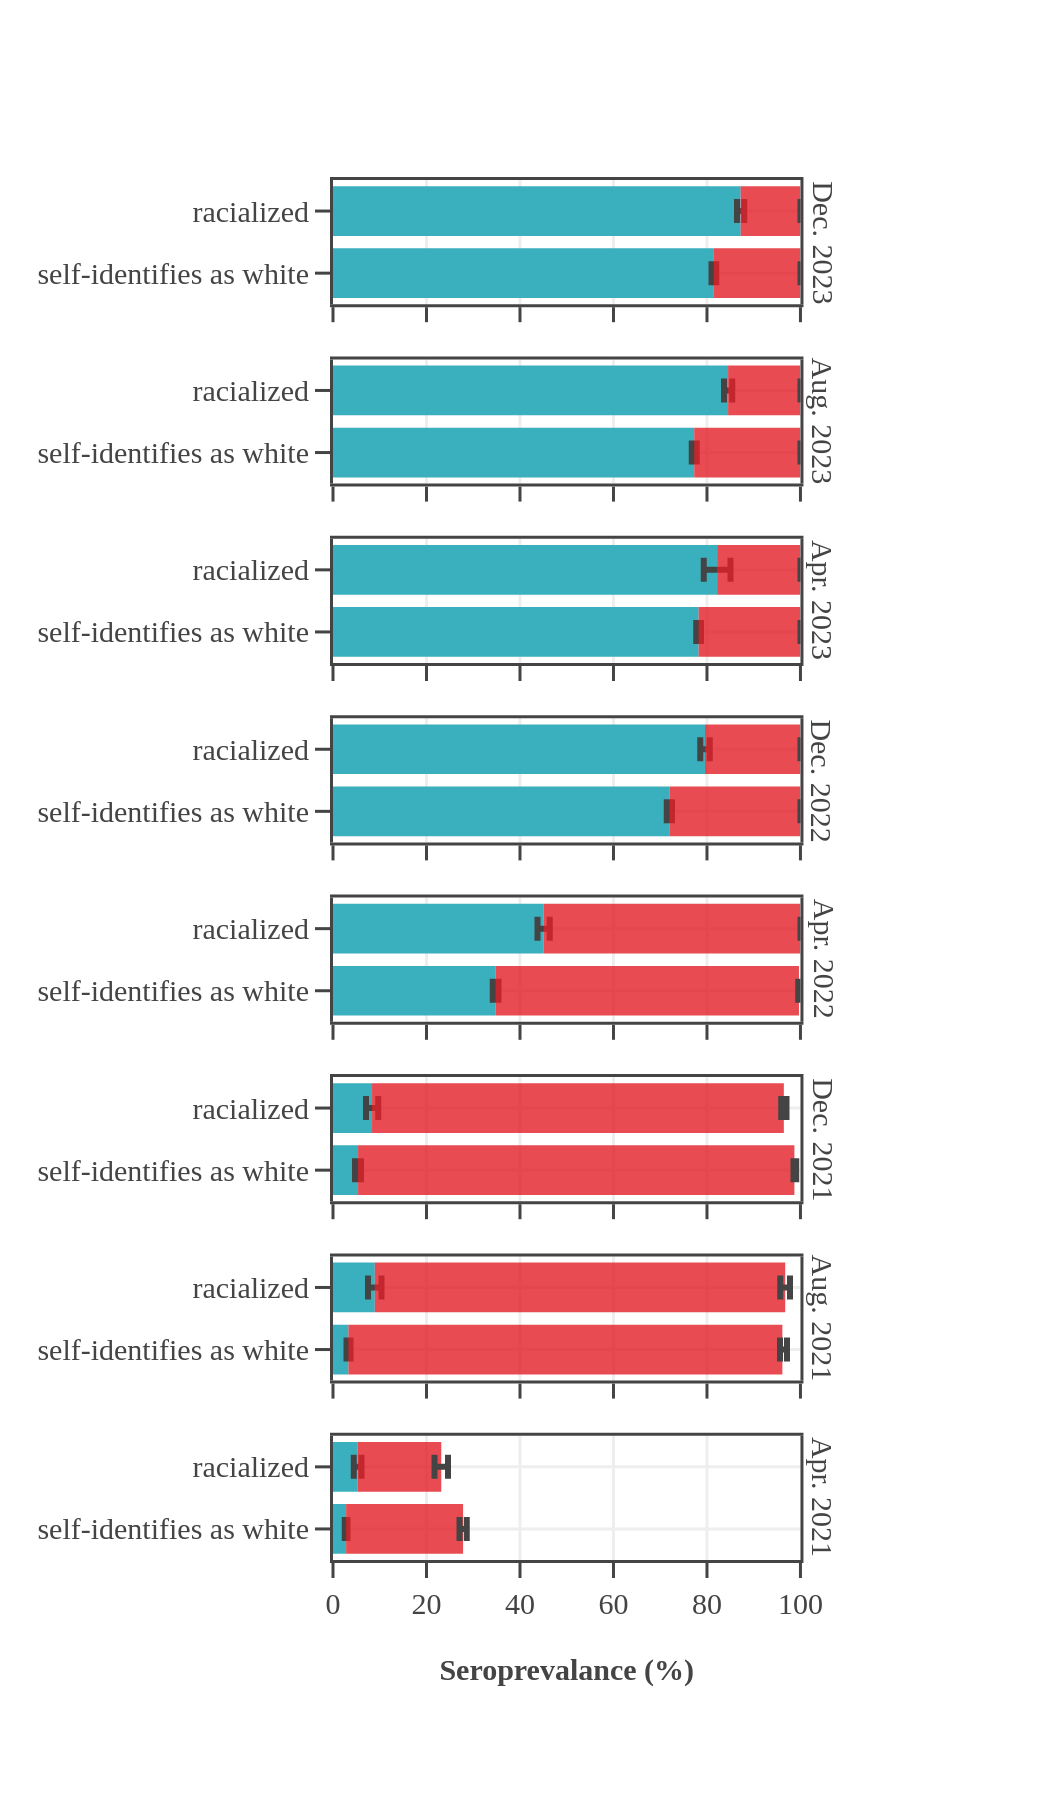
SARS-CoV-2 antibodies
| Infection (Roche assay) | Vaccine only (Roche assay) |
Data notes:
- The bar height shows the estimated proportion of the subgroup who had antibodies to SARS-CoV-2, adjusted for assay sensitivity and specificity and standardized to the Canadian population. Error bars show 95% confidence intervals.
- Antibodies from vaccine only are in red = anti-S IgG positive and anti-N IgG negative.
- Antibodies from infection are in blue = positive for anti-nucleocapsid IgG.

Looking for more of this data?
- Do you need the population-level data shown in the graphs above? Visit the CITF Open Access Dataverse to access our aggregate data.
- Do you need individual-level data? Discover the CITF Databank.
- Do you need other population-level SARS-CoV-2 serology tabulations? Please contact our Data team at data@covid19immunitytaskforce.ca.